
Microsoft 365 assessment
Turn license renewal into an opportunity to optimise your Microsoft estate with actionable insights and expert analysis.

M365 renewal season is here
With license renewal approaching, you might be asking yourself:
- How can I save money on my renewals?
- How can I better control my licensing spend?
- Why shouldn’t I just renew what I’ve got?
Our M365 optimisation assessment equips you with the data needed to ensure you only pay for licenses and features you need at the lowest cost.
Get a better ROI from your NCE agreement
For a minimum license of 100 seats, we can efficiently review your usage on an individual basis.
From this, you gain practical insights for cost reduction, regulatory compliance and license optimisation.

Your blueprint for M365 license efficiency
Gain the insights needed into actual license usage, creating a solid foundation for optimisation.
1
Discovery call
Have a chat with a member of our team to start your M365 optimisation assessment.

2
Gather data
Upon approval, we gather rich data on license usage and Microsoft consumption.
3
Analyse results
We will evaluate our findings including inactive users, individual consumption and application usage.
4
Tailored insights
You will receive a detailed report with actionable insights on license optimisation & rationalisation.
Unlock M365 license insights on a granular level
From the number of licenses used to adoption of specific technologies, we identify a breadth of data around your real-world license usage and where cost savings can be made.
Example report 1:
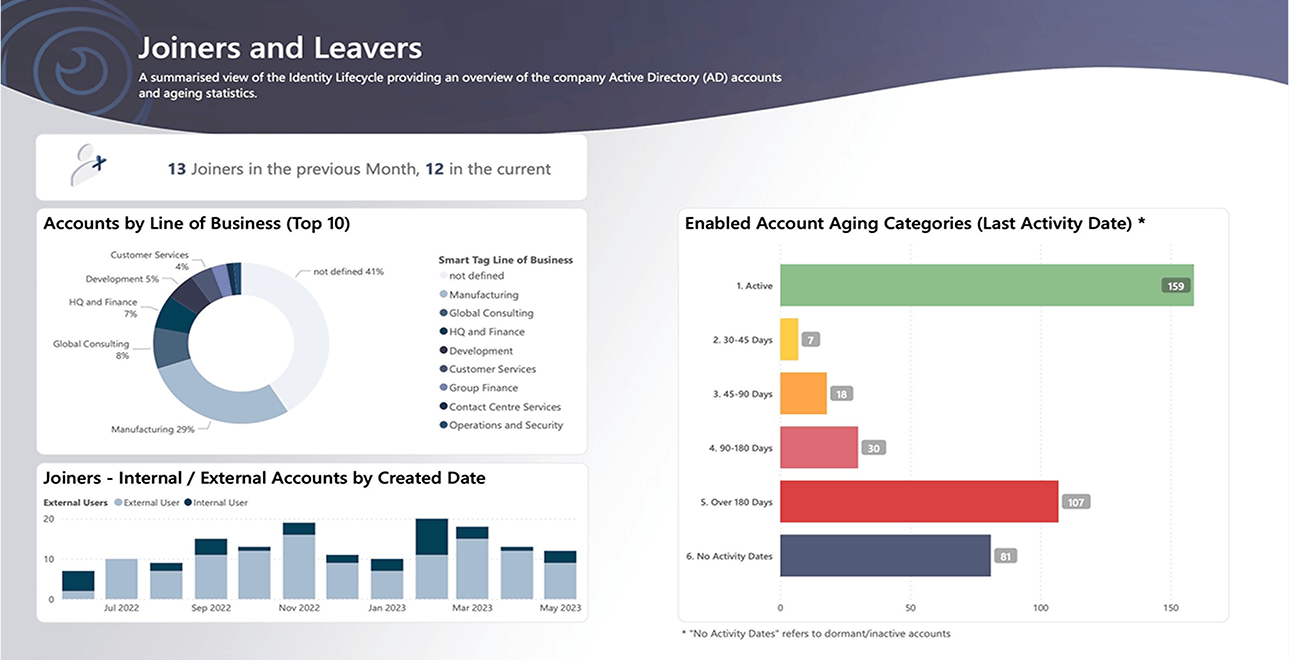
Joiners and Leavers
Access data on new accounts, removed accounts and their activity levels across different departments to understand trends in user creation and inactivity.
Example report 2:
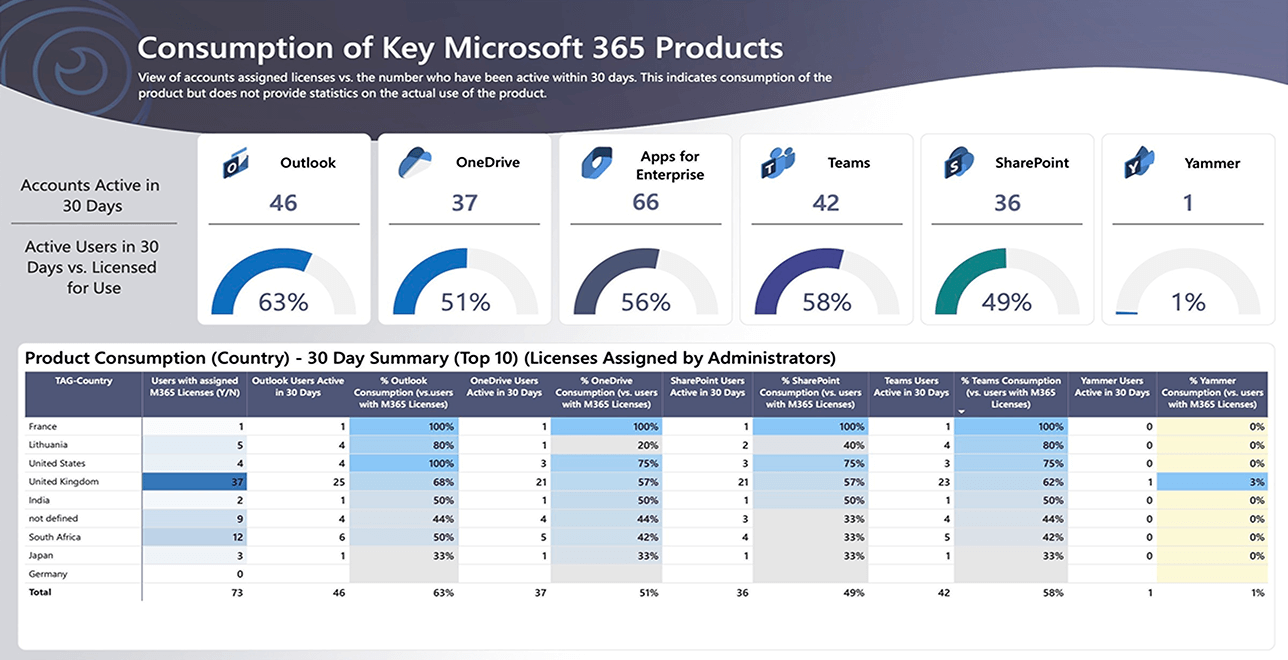
Consumption of Key M365 Products
View how many licensed users across regions are using each M365 product within a 30-day period.
Example report 3:
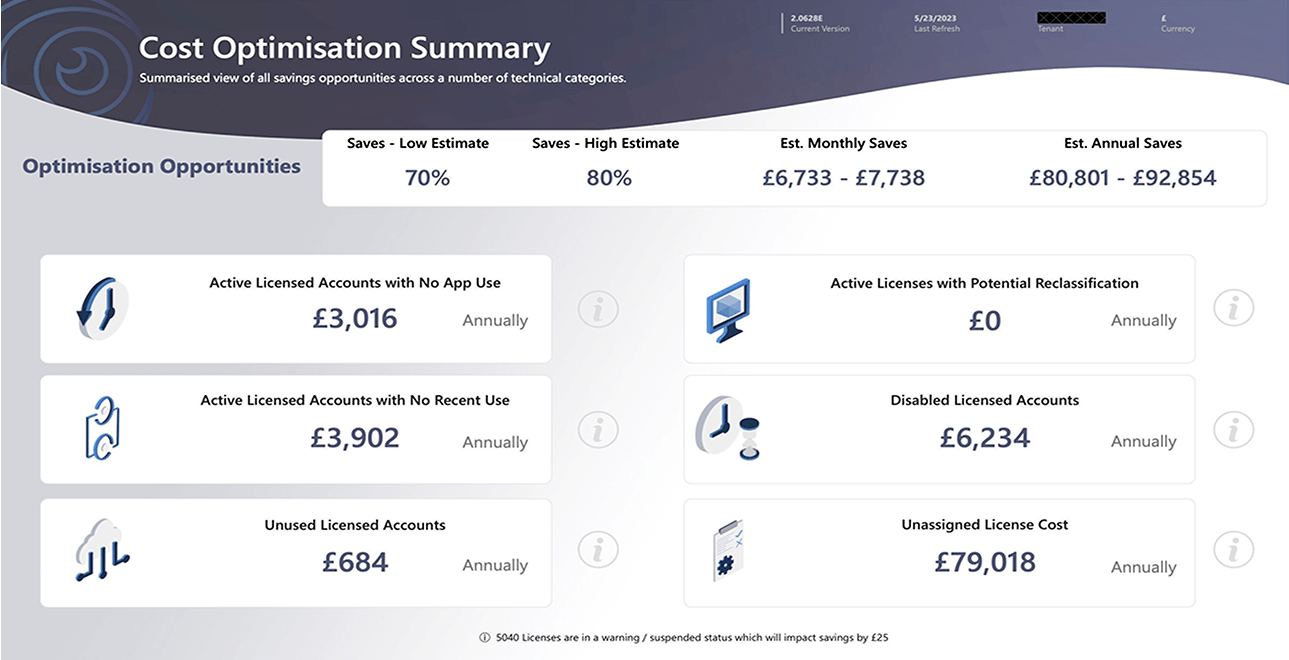
Cost optimisation summary
Gain a summary of savings opportunities across a range of technical categories to identify where you could reduce waste and get better ROI on your license agreement.

How much could you save on your M365 licenses?
Access a detailed report on your license use per seat with our rapid assessment underpinned by expert advice.