Reimagine your M365 license potential
Turn license renewal into an opportunity to optimise your Microsoft estate with actionable insights and expert analysis.

No longer eligible for an Enterprise Agreement?
It’s time to determine the most effective license mix to optimise operations through your NCE agreement. To do this, you’ll need to know:
- Are my licenses aligned with business needs?
- What’s my actual M365 usage and spend?
- Am I getting the maximum ROI from my license agreement?
Our Microsoft 365 optimisation assessment delivers the clarity you need to ensure you only pay for what you need—no more, no less.
An opportunity for license optimisation
Our assessment starts by looking at how you’re using M365 on a per seat basis to understand usage on a granular level.
As a result, you can build a bespoke license agreement with the specific add-on features your business requires.

Laying the foundation for M365 license efficiency
Get actionable data on your license usage so you can get more out of your M365 agreement than ever before.
01
Discovery call
Have a chat with a member of our team to start your M365 optimisation assessment.

02
Gather data
With your approval, we gather key data on license usage and Microsoft consumption.
03
Analyse results
We evaluate the data to identify underutilised licenses, inactive users and application consumption trends.
04
Tailored insights
Receive detailed insights as your first step towards license optimisation & rationalisation.
Unlock M365 license insights on a granular level
From licenses used and churned accounts to technology adoption across the business, we uncover critical insights on a per-user basis for visibility of your actual M365 usage.
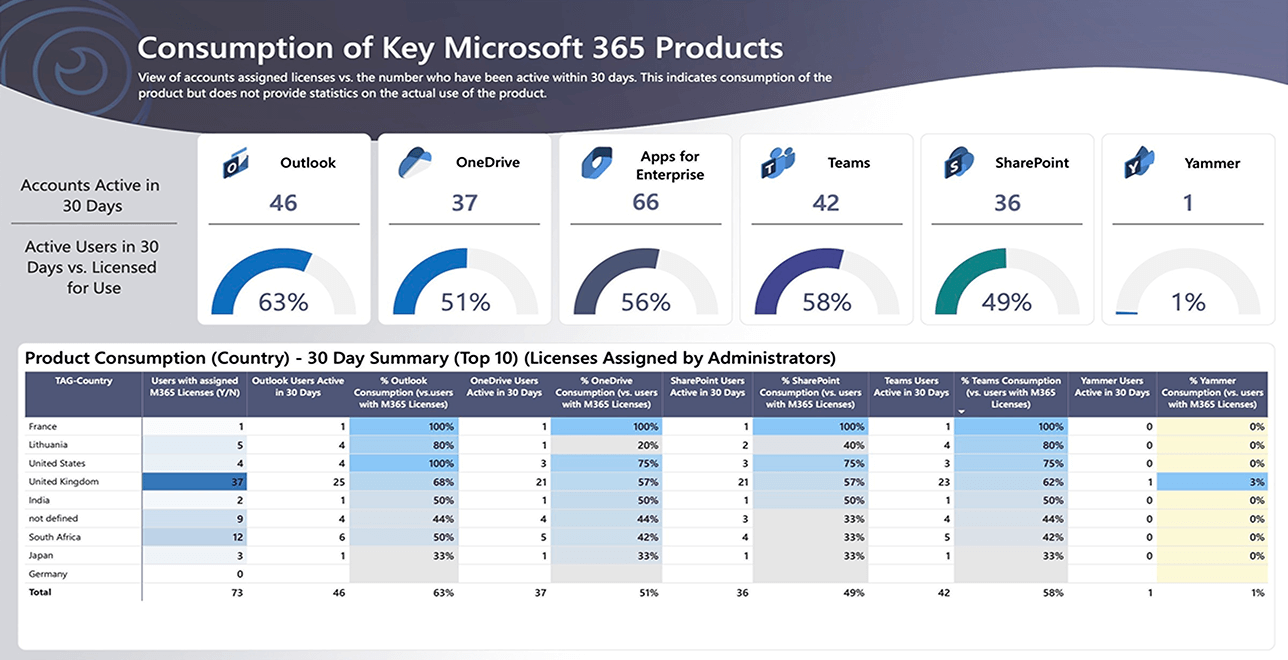
Example report 1:
Consumption and adoption
Access data on new accounts, removed accounts and their activity levels across different departments to understand trends in user creation and inactivity.
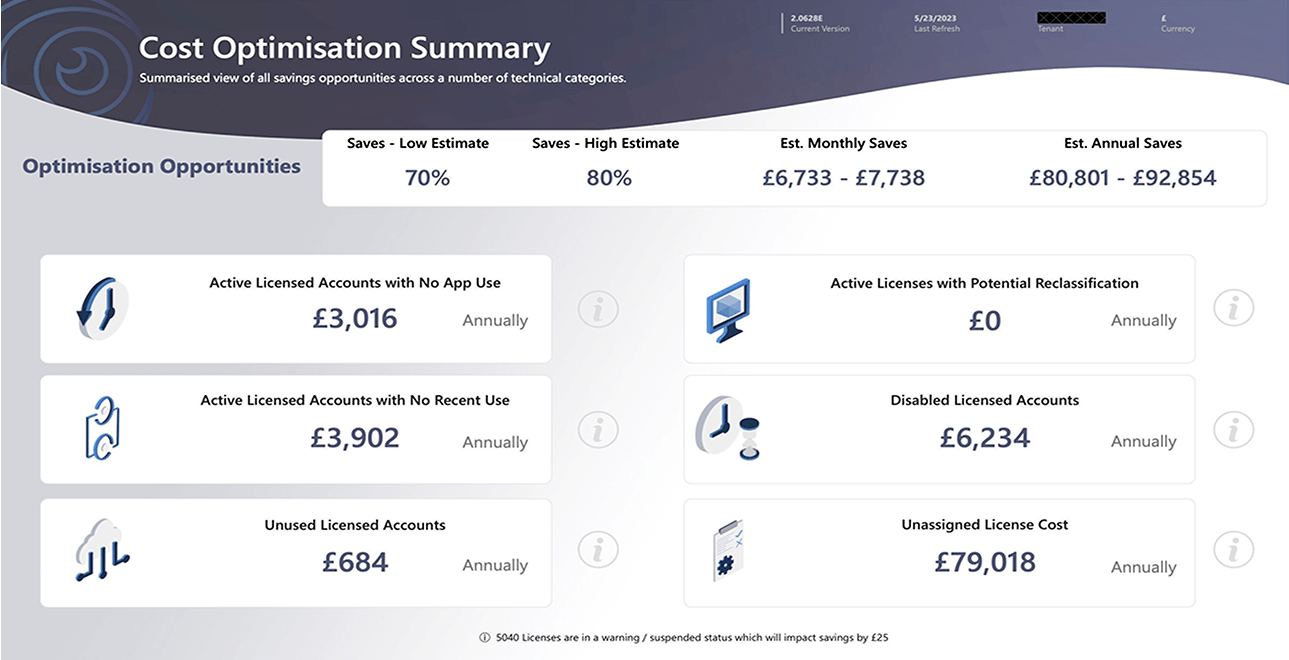
Example report 2:
Device usage
Access information around M365 app usage by region and device to spot where and how staff engage with services.
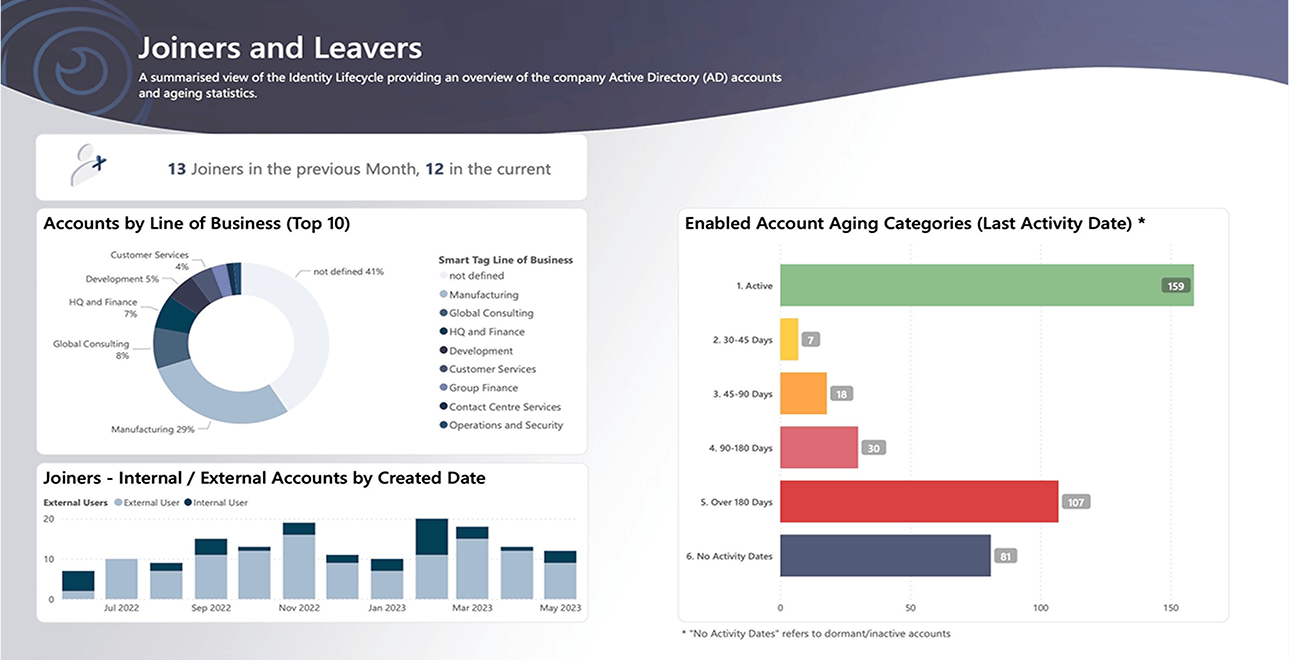
Example report 3:
Cost optimisation summary
Gain a summary of savings opportunities across a range of technical categories to identify where you could reduce waste and get better ROI on your license agreement.